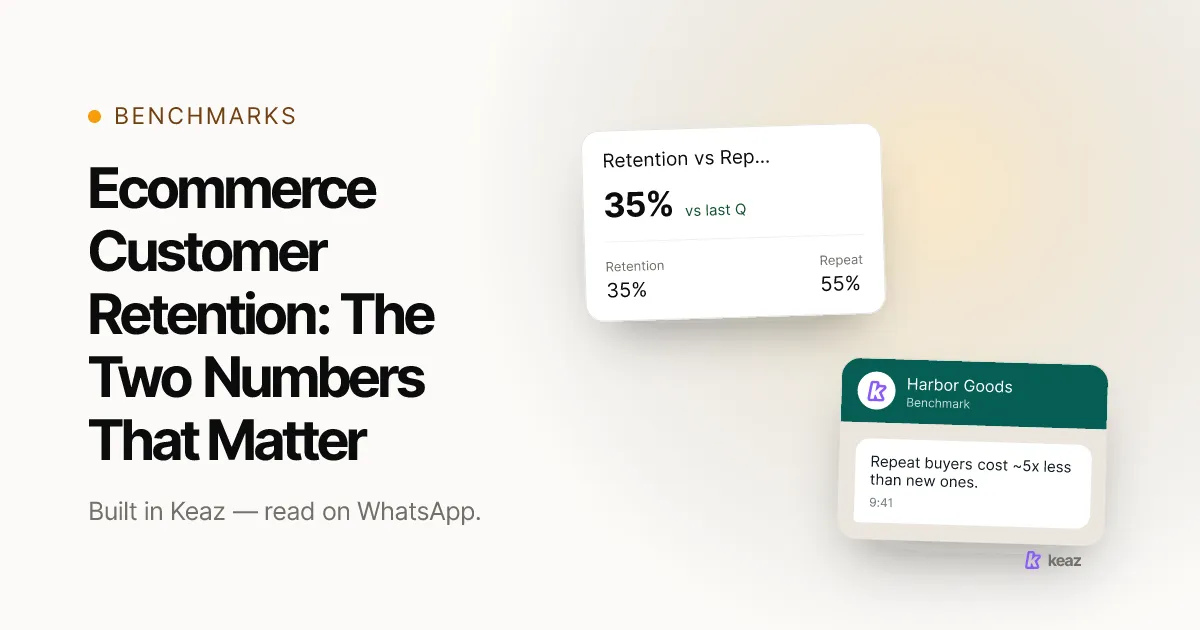
Customer retention in an online shop is not the SaaS metric that shares its name. There is no contract to renew and no MRR to lose. A Shopify customer simply stops coming back — quietly, with no cancellation event and nothing in the dashboard to flag it. So the honest place to start is not a strategy. It is two numbers: what share of last period's customers bought again, and how much of your revenue comes from people who had bought before.
Three figures worth having in front of you first:
- 5 to 25 times — how much more expensive acquiring a new customer is than keeping an existing one, depending on the study and the industry (Harvard Business Review, 2014, retrieved 2026-09-10).
- 70.22% — the average documented cart abandonment rate across 50 studies (Baymard Institute, last updated 22 September 2025, retrieved 2026-09-10). For most shops this is the largest pool of almost-earned revenue there is.
- 2 metrics — customer retention rate and repeat purchase rate. Everything past those two is refinement, and most shops never get the first two onto one page.
What does customer retention mean for an online shop?
The definitions ranking on the generic retention keywords were written for subscription software. They assume a contract, a renewal date and a recurring revenue line. A Shopify store has none of the three, and copying the framing across produces numbers that look rigorous and mean very little.
Three things change when you move the metric into commerce:
- Nobody churns — they just stop. There is no cancellation to count, so retention has to be measured from what happened rather than from what was ended. That makes the choice of period the whole measurement, not a footnote to it.
- Your repurchase cycle sets the window. A coffee roaster measures in weeks. A furniture shop measures in years. A 30-day window borrowed from a SaaS dashboard tells a furniture shop nothing at all, and it will look alarming for reasons that have nothing to do with the business.
- It is a revenue question first. Loyalty is the pleasant word for it, but the operational version is simpler: which existing customers will spend again, and what is that worth? That is the same question the Keaz Forecast answers from your own Shopify data.
The practical upshot: before you improve retention, define what you are counting and over what period. A store that cannot say which window it uses cannot tell a real improvement from a seasonal one.
How do you calculate retention rate and repeat purchase rate?
Two calculations, both of which run off order data you already have in Shopify. Neither needs a tool to produce the first time.
Customer retention rate
- Choose a period that matches your repurchase cycle — one to two typical cycles, not a calendar quarter chosen for convenience.
- Count the customers you had at the start of the period (S).
- Count the customers you had at the end (E).
- Count the new customers acquired during it (N).
- Retention rate = ((E − N) ÷ S) × 100.
Worked through: you start with 1,000 customers, end with 1,150, and acquired 300 new ones along the way. ((1,150 − 300) ÷ 1,000) × 100 = 85%. The 300 new customers are removed deliberately — acquisition is not retention, and leaving them in is the most common way a shop convinces itself the number is fine.
Repeat purchase rate
- Repeat purchase rate = (customers with two or more orders ÷ total customers) × 100, over the same window.
- Worked through: 1,200 customers in the period, 260 of them with two orders or more, gives 21.7%.
Why you need both. Retention rate tells you whether you are leaking customers. Repeat purchase rate tells you whether a second order happens at all. A shop can post a respectable retention rate while a small group of loyalists carries it and almost nobody makes a second purchase — the two numbers only look redundant until they disagree, which is the moment they become useful. Once both are stable, they roll up into customer lifetime value, which is the number worth optimising against. How Keaz derives its own figures from shop data is set out in the Forecast methodology.
Which four levers actually move these numbers?
Four levers move these two numbers for a Shopify store. This section orders them; each has its own guide, because each is a separate build.
- The checkout that did not finish. The nearest revenue to hand, and the reason the 70.22% figure above matters. Our guide to WhatsApp cart recovery covers the sequence; the Abandoned Checkout trigger in the help center covers the setup and the timing.
- The second order. Turning a first-time buyer into a returning one is the single change that moves repeat purchase rate directly. See turning one order into three, built on the Contact Purchase trigger.
- Replenishment and subscription churn. If your product runs out on a predictable schedule, the failure mode is a missed reorder rather than a lost customer. WhatsApp for subscription brands deals with that case.
- Segmentation. Knowing which customers are worth a message, so the other three levers are aimed rather than broadcast. RFM analysis for Shopify is the method we use.
Pick one and finish it. Running all four at half attention is worse than running the first one properly — and, as the next section explains, it also makes the result impossible to attribute.
How do you know a lever worked?
A lever you cannot measure is a lever you will argue about. Three habits make the difference between a number you can act on and a number you can only defend.
- Give every flow its own discount code. Attribution in Keaz works by matching a redeemed code back to the message that sent it, so two flows sharing a code produce one unusable figure. Revenue tracking: one discount code per flow explains the setup.
- Compare against the same window last year, not last month. Retail demand is seasonal in both directions. A month-on-month comparison in a seasonal catalogue mostly measures the season.
- Wait a full repurchase cycle before judging. A reorder lever for a product people buy twice a year cannot be evaluated in six weeks, however tempting the early numbers look.
One channel note, because it comes up every time: WhatsApp complements email rather than replacing it. It earns its place on time-sensitive prompts — a cart that is still warm, a reorder due this week — where visibility matters more than length. The message templates and flows available are listed under features.
Common mistakes
Every one of these has produced a confident retention number that later turned out to mean nothing.
- Borrowing someone else's measurement window. A 30-day window is standard in subscription software and meaningless for a catalogue people buy from twice a year.
- Leaving new customers in the retention rate. Subtracting N is the whole point of the formula. Skip it and a good acquisition month reads as a good retention month.
- Counting a discount-driven second order as retention. An order placed entirely on a 20% code tells you about the code. Track those orders, but do not let them carry the metric.
- Reading one high-value repeat customer as a trend. At small order counts a single wholesale-sized order moves the rate several points. Check the customer count behind the percentage before you act on it.
- Launching all four levers in one week. Nothing is attributable afterwards, and the lever that actually worked gets credit shared with three that did not.
- Treating frequency as a retention strategy. More messages is not better timing. On WhatsApp it is also the quickest route to being blocked, which costs you the contact permanently.
- Messaging without a documented opt-in. Every WhatsApp message needs explicit, recorded consent — see collecting WhatsApp opt-ins the GDPR-compliant way. This is a summary rather than legal advice; have your own counsel review your setup.
Ecommerce customer retention is a measurement problem before it is a marketing problem. Put the two rates on one page, define the window from your own repurchase cycle rather than from a SaaS template, pick the lever earliest in the funnel, and give it a discount code so the result is provable. That sequence is unglamorous and it is the one that survives a second quarter.
If you want the revenue side of the question answered from your own numbers before you build anything, the Keaz Forecast calculates it from your Shopify data.
Frequently asked questions
What is a good customer retention rate for an online shop?
Is retention rate the same as repeat purchase rate?
How long should the measurement period be?
Do I need WhatsApp to improve retention?
How do I see which flow actually produced revenue?

Nils Spölgen
Founder at Keaz. Serial founder in chat marketing — built a local agency into Keaz, the WhatsApp marketing platform for Shopify. Bootstrapped the MVP, raised funding, and scaled to 200+ merchants in DACH. Writes about flows, opt-in & GDPR, Klaviyo, and realistic revenue benchmarks — prefers conservative math over impressive claims. View profile