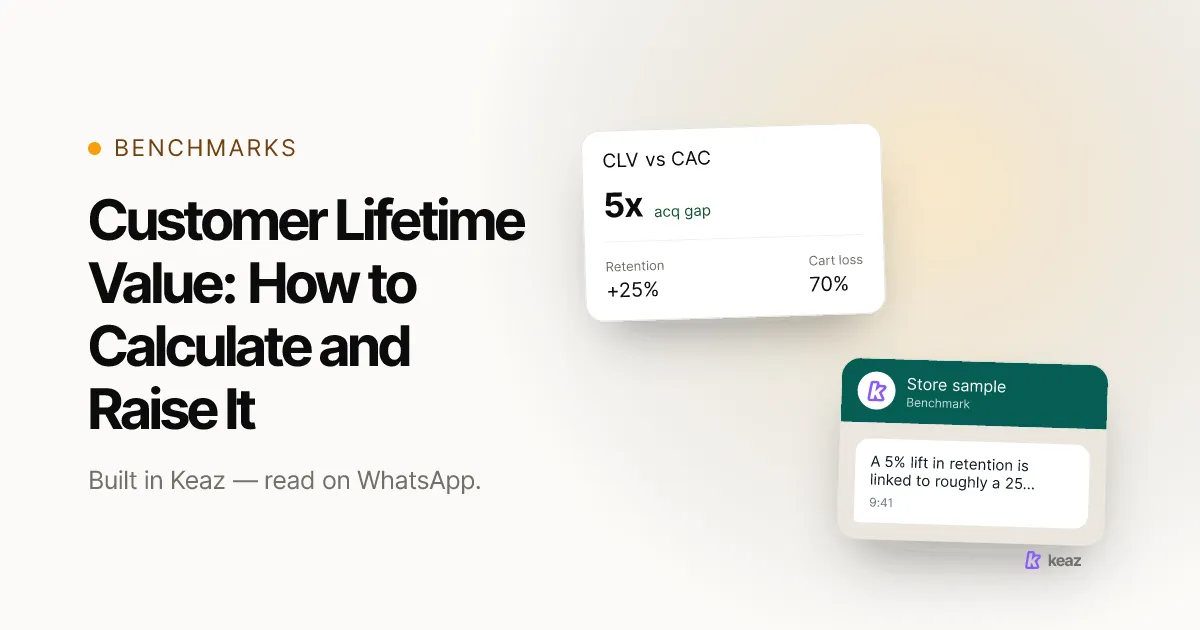
Customer lifetime value (CLV) is the total gross profit one customer produces across the whole relationship with your store - not the value of their first order. The working formula is average order value multiplied by purchase frequency per year, by expected years as a customer, by your gross margin. That is the figure worth comparing against what you pay to acquire someone, and it is the figure most Shopify dashboards do not show you.
Three numbers to hold on to before you start:
- Acquiring a new customer costs five to 25 times more than retaining an existing one, depending on the study and the industry (Harvard Business Review, 2014, retrieved 2026-09-08).
- Raising retention by 5% has been linked to profit increases of 25% to 95% in Bain & Company research. That is a very wide band - plan against the 25%.
- 70.22% is the average documented cart-abandonment rate across 50 studies (Baymard Institute, last updated September 2025, retrieved 2026-09-08). Those are near-customers with known intent, and most stores never message them again.
What is customer lifetime value, and what is the formula?
Customer lifetime value answers one question: how much gross profit will this customer produce before they stop buying? Everything else - average order value, repeat purchase rate, churn rate - is an input to it. The formula that survives contact with a real shop is short:
CLV = average order value x orders per year x expected years as a customer x gross margin
Two decisions inside that line do most of the damage when they go wrong. The first is revenue versus gross profit. A EUR 60 order at a 55% margin contributes EUR 33, and planning against the EUR 60 will have you overspending on acquisition all year. The second is whether you are measuring backwards or forwards. Historic CLV tells you what past customers were worth and is a fact. Predictive CLV estimates what current customers will be worth and is a forecast - useful, but never quote it as though it were settled.
A worked example with round numbers, not benchmarks: a store with a EUR 60 average order value, 2.4 orders per customer per year, a 2.5-year expected relationship and a 55% gross margin has a CLV of roughly EUR 198. If acquisition costs EUR 66 per customer, the ratio is 3:1 and the model works. At EUR 120 it does not, and no campaign fixes that arithmetic - only a change to one of the four terms does.
How do you calculate CLV from your Shopify data?
You need four numbers, and your shop already holds three of them.
- Average order value - total revenue divided by number of orders, over a rolling 12 months. Use the full year so seasonality averages out rather than deciding the answer.
- Purchase frequency - orders divided by unique customers, over the same window. A result close to 1.0 means you are running a single-purchase business, whatever the marketing plan says, and that is worth knowing before you spend on retention.
- Gross margin - take out cost of goods, the shipping you absorb, payment fees and returns. Not net margin: overheads do not belong in a per-customer figure, because they do not scale with one more customer.
- Expected lifespan - the hard one. With three years of history, take a cohort from 24 to 36 months ago and measure how long they actually kept buying. Without it, use 1 divided by your annual churn rate and label the result an estimate every time you quote it.
Then multiply - and do it per segment rather than once for the whole shop. A single blended CLV hides the thing you actually need to see: your top decile may be worth six or eight times your median, and that spread is what decides where the next euro of budget goes. Our forecast methodology page applies the same principle to revenue projections: rates calibrated per vertical, rather than one average stretched across everyone.
Which four levers actually raise customer lifetime value?
CLV has exactly four inputs, so it has exactly four levers. Anything you are asked to do that does not move one of them is not a retention measure, whatever it is called.
- Order frequency. Shorten the gap between orders by arriving when the last one runs out, not when the campaign calendar says so. A consumable with a 40-day supply wants a message around day 35, and that timing is worth more than the copy.
- Average order value. The cheapest cross-sell is the one that follows a known purchase, because you already know what they bought and what pairs with it. Bundles and thresholds work on the same principle and can be tested against each other.
- Lifespan. Most churn is not a decision, it is a drift. Catch it while a customer is late rather than lapsed - roughly 1.5 times their normal reorder gap is a sensible trigger to test first.
- Margin. Discounts buy frequency and sell margin. That trade can be worth making, but only if you can see both sides of it. If you cannot say what a discount bought, it is not a lever, it is a leak.
There is a fifth constraint that is not part of the formula but caps all four: whether you can reach the customer at all. Email reaches the customers who still open it, and that share is smaller than most stores assume. Our revenue forecast models that gap for a given store - how much of your customer base one channel actually touches, and what the remainder is worth per month. Reachability is why a retention programme built on a single channel plateaus, and turning one order into three covers the message-sequence side of the same problem.
How do you segment by value instead of by campaign?
Value segmentation means the audience is defined by what someone is worth and how they behave, not by which campaign is due. In Keaz that lives in the Segment Builder, which filters on shop data including total revenue, average order value, order count, last purchase, RFM group and predicted spend tier, and combines those conditions with WhatsApp behaviour and opt-in level.
Two of the panels there are worth reading together. The builder shows a segment's average order value next to the average time since its last purchase. A large segment with a low average order value and a long time since the last purchase is a reactivation audience, not a high-value one - and that should change both what you send it and how much margin you are willing to spend doing so.
Four segments are enough to start with: high value and active, high value and slipping, low value and active, and everyone else. The second is where the money is, because you are protecting profit that already exists rather than trying to manufacture it. If you want the formal scoring model underneath this, RFM analysis for Shopify sets out the scoring and the eleven segments it produces.
How do you know whether it worked?
CLV moves slowly, which makes it easy to claim credit for and hard to verify. Three rules keep the measurement honest.
- Attribute per campaign, not in aggregate. Keaz does this with one discount code per flow. The code is created in Keaz, appears in your shop system automatically and goes into the message as a variable, so redeemed revenue lands against the flow that sent it. Share one code across two flows and you lose the ability to tell them apart.
- Compare cohorts, not months. Month-on-month revenue mixes new and returning customers, so it will show an improvement any time acquisition goes up. Take the customers who first bought in a given month and follow that group instead.
- Wait two to three purchase cycles. For a 40-day reorder cycle that is four to six months. Judging a retention change after three weeks measures noise and then acts on it.
One caveat on what the attribution does not capture. A discount code catches the orders where it was redeemed, so a customer who comes back because your reorder reminder was well timed but buys at full price will not appear in that figure. Read attributed revenue as a floor rather than a total, and check it against the cohort view. The Keaz feature overview shows where each of these numbers is reported.
Common mistakes
Six ways a CLV number goes wrong, in rough order of how often it happens.
- Using revenue instead of gross profit. The most common error, and it inflates CLV by exactly your margin gap. At a 55% margin a revenue-based CLV is nearly twice the real figure, which quietly doubles what you think you can spend on acquisition.
- One CLV for the whole shop. A blended average is the one number guaranteed to describe none of your actual customers. Segment first, then calculate.
- Quoting a predicted lifespan as a fact. Predicted spend and expected lifespan are forecasts. Label them as such, and never build a discount budget on the optimistic end of a band.
- Buying frequency with margin. Two extra orders a year at 30% off can leave CLV lower than it started. Recalculate the margin term after a discount programme, not before it.
- Measuring monthly rather than by cohort. This credits retention work for acquisition growth, and it does so consistently enough that nobody thinks to question it.
- Optimising CLV for customers you cannot reach. If a large share of your list is unreachable on the channel you are optimising, you are improving the metric for the customers who were already loyal. Fix coverage before you fix messaging.
Customer lifetime value is not really a reporting metric. It is a budget constraint. Once you know what a customer in each segment is worth in gross profit, you know what you can afford to spend acquiring them, how much discount a reactivation is allowed to cost, and which segment deserves the next campaign. Work it out per segment, in gross profit, across cohorts - and re-run it every quarter, because it moves.
If you want to see what a second reachable channel would add to that number for your store, the Keaz revenue forecast runs the calculation on your vertical, your customer count and your current phone-capture setting.
Frequently asked questions
What counts as a good customer lifetime value?
What is the difference between CLV and average order value?
What time window should I use to calculate CLV?
Can a store less than a year old calculate CLV?

Nils Spölgen
Founder at Keaz. Serial founder in chat marketing — built a local agency into Keaz, the WhatsApp marketing platform for Shopify. Bootstrapped the MVP, raised funding, and scaled to 200+ merchants in DACH. Writes about flows, opt-in & GDPR, Klaviyo, and realistic revenue benchmarks — prefers conservative math over impressive claims. View profile