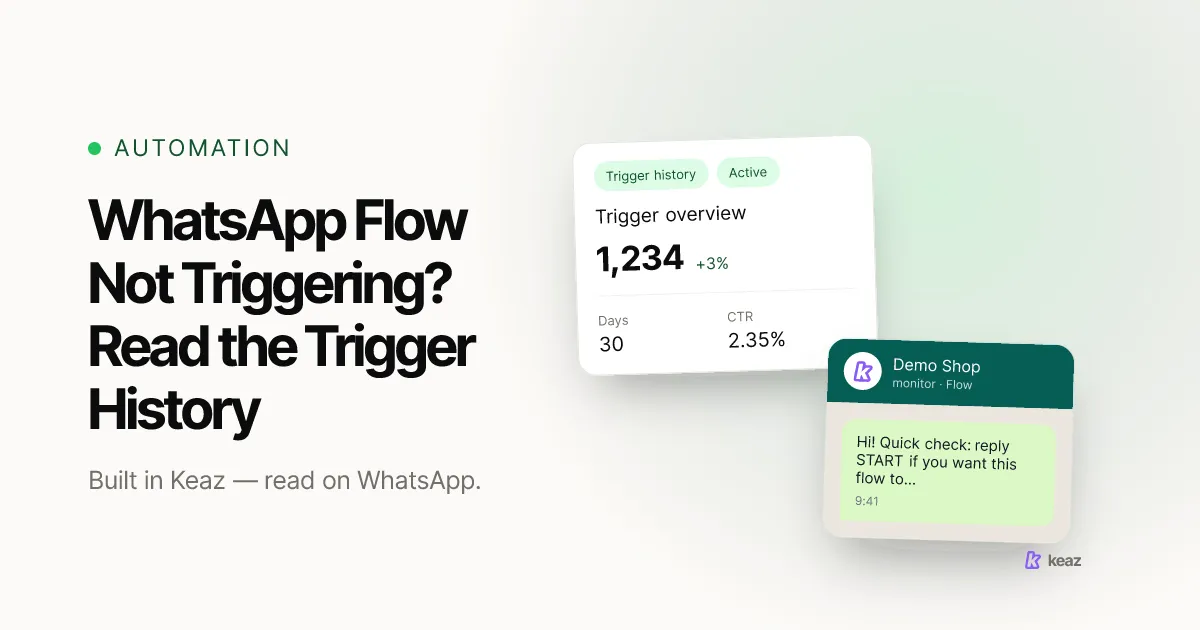
A WhatsApp flow not triggering is the quietest failure in your stack. Nothing bounces, no error appears, no send fails — the flow simply never starts, and the only symptom is revenue that never shows up. Since 16 August 2026 the flow detail view in Keaz shows a per-day trigger count for the last 30 days, which turns I think it is running into a number you can read. This guide covers what a healthy trigger curve looks like, the four shapes that mean something is wrong, and how to tell a flow problem from a coverage problem.
In short
- The graph covers 30 days, one value per day, and draws a day with zero triggers as zero instead of leaving a gap — so a flow that stopped on a particular date appears as a step down, not as a hole in the line.
- Five trigger types can start a flow: Contact purchase and Abandoned checkout, which are both Shopify events, plus Smart activation, Webhook and Chat-in. Only 2 of the 5 depend on a Shopify event reaching Keaz at all.
- A curve that follows your orders at a fraction of their volume is a coverage problem, not a flow problem. Shops typically start with 35–55% of their last-12-months customers reachable on WhatsApp, and the checkout phone field moves capture from around 22% to 65–70% when it is actively encouraged.
Where do you find the trigger history?
Open the flow and look at its detail view. The trigger history sits with the flow's other live metrics and answers exactly one question: how many contacts entered this flow on each of the last 30 days. Days with no triggers are drawn as zero rather than skipped, which is the detail that makes the graph diagnostic — on a chart that omits empty days, a gap and a genuine zero look identical, and they mean completely different things.
It sits in front of two metrics that were already there. Block-level metrics show where contacts move on and where they stop inside the sequence, and the flow finish rate shows what share of them reached the end. Both are downstream of the trigger count: if nothing enters, nothing can finish, and a finish rate calculated on four contacts tells you nothing. Read the trigger count first, then the block metrics, then the finish rate. Our help article on how flows are built sets out the Starting point, Messages blocks and Delay blocks, which is the vocabulary the rest of this guide uses.
What does a healthy trigger curve look like?
A healthy curve is one you could have predicted from your own numbers. It follows the underlying event, it carries your normal weekday rhythm, and it has no days that are suspiciously round. What the shape should track depends on which of the five triggers starts the flow.
- Contact purchase should broadly follow your daily order count, reduced by the share of customers who are not reachable on WhatsApp.
- Abandoned checkout should sit above Contact purchase, because more people start a checkout than complete one.
- Chat-in follows inbound message volume and is spikier than either, because it reacts to your campaigns and your ad spend rather than to orders.
- Webhook follows whatever the calling system does, so the reference curve lives in that system, not in Keaz.
- Smart activation is deliberately uneven. Keaz works out the sending moment per contact to keep spam reports low and protect your WhatsApp account quality, so some days carry several messages and others very few. An irregular Smart activation curve is the feature working, not a fault.
Two rules of thumb. Compare the shape to your orders rather than to an absolute number — 40 triggers a day is excellent for one shop and a symptom for another. And read the last two or three days separately: they are usually still filling in, so a dip at the right-hand edge of the graph is the most common false alarm there is.
What do the four broken curve shapes mean?
- Flat at zero across all 30 days. The flow has not triggered once. Check the flow state first — an inactive flow is the most common cause and the fastest fix. If it is active, the problem is almost always in the Starting point: the trigger type is not the event you think it is, or the filters and labels are narrower than intended. Trigger and filters do different jobs. The trigger decides what starts the flow; the filters and labels decide who actually enters it, so a correct trigger with an over-tight filter produces exactly this curve.
- A cliff on a specific date. Something changed that day, and the date is the clue. Line it up against your own change log: a theme or app deploy, a revoked Shopify permission, an edited filter, an expired discount code, a paused flow that nobody re-enabled. A cliff is rarely a platform problem and almost always a change nobody connected to this flow.
- A spike with no equivalent in your order volume. Usually a bulk event rather than customer behaviour: a contact import, a re-sync, or a replayed webhook that pushed a batch through the Starting point at once. Those messages went out, which is why this shape deserves more attention than the others rather than less — a batch that entered a Winback or Post-Purchase flow reached real customers with a message timed off a re-sync instead of off their purchase.
- Tracks your orders, but at a fraction of the rate. This is the shape people misread most often. The flow is working; the audience is too small. A Shopify-triggered flow can only reach customers who have a phone number on file and an opt-in, so a flow that fires on 30% of qualifying orders is usually reporting your contact coverage back to you.
When the curve is flat, the two Shopify triggers each have a help article worth re-reading: the Contact purchase trigger and the Abandoned checkout trigger. If the shape is right but the audience is wrong, our guide to targeting flows by product or collection covers how trigger filters narrow entry — and how easily they narrow it too far. You can see the full set of ready-made flows on the Keaz flow templates page.
Why might a Shopify event not arrive?
Two of the five triggers depend on Shopify telling Keaz that something happened, and that message is a webhook. Shopify's own developer documentation is explicit that webhook delivery is not guaranteed, that an app should not rely on receiving every event, and that ordering within a topic is not guaranteed either; it recommends reconciliation — periodically re-reading data from Shopify — as the redundancy for exactly this case (Shopify Developer Documentation, webhook best practices, retrieved August 2026).
In practice this matters less than it sounds and more than merchants expect. Less, because missed events are rare and a 30-day per-day graph renders them as noise rather than as a shape. More, because it is the right explanation for a small unexplained shortfall and the wrong explanation for a flat line. A curve that is a few percent short of your orders is not worth an investigation. A flat curve is a configuration problem. And a large, stable shortfall is coverage, not delivery — check the Shopify connection and its permissions before you suspect lost events, because a revoked scope produces a cliff and looks nothing like intermittent loss. Shopify's webhook troubleshooting guide (Shopify Developer Documentation, 2026) is the reference if you want to go further.
Is it a flow problem or a coverage problem?
The distinction decides what you do next, and the trigger graph is the fastest way to make it. A flow problem is a shape that does not match your shop: flat, cliffed, or spiking. A coverage problem is a shape that matches your shop precisely but sits well below it. Fixing the first is configuration work inside one flow. Fixing the second raises every flow at once, which is usually the better use of an afternoon.
Coverage has a name and a number in Keaz. Customer Contact Coverage, or CCC, is the share of your last-twelve-months Shopify customers who are reachable on WhatsApp. Shops typically start between 35% and 55% and reach 85% or more within about 60 days of working on it. The single biggest lever is the phone number field at checkout, which moves capture from roughly 22% to 65–70% when it is actively encouraged rather than merely present. Our guide to collecting phone numbers at Shopify checkout covers how to do that without hurting conversion.
If you want the revenue side of the same arithmetic before changing anything, the Keaz Forecast puts a euro figure on your current coverage gap, and how the Forecast is calculated documents the inputs so you can argue with them. The graph is what tells you the constraint is coverage rather than configuration; the Forecast is what tells you whether it is worth the afternoon.
Common mistakes
- Reading the last two days as a trend. The right-hand edge of the graph is still filling in. Compare full days only.
- Judging a finish rate before the trigger count. A 90% finish rate on six contacts is not a result. A 40% finish rate on 4,000 is.
- Assuming a flat curve means something is broken. In the great majority of cases it is an inactive flow or a filter that excludes everyone, and both are visible in the Starting point in under a minute.
- Blaming webhook delivery for a large shortfall. Intermittent loss is small and irregular. A large stable shortfall is coverage, and a sudden one is a permission or a configuration change.
- Tuning one flow when coverage is the constraint. If every Shopify-triggered flow is short by roughly the same proportion, the flows are not the problem and tuning them will not help.
- Ignoring a spike because the messages already went out. A spike is the one shape that already reached customers. Find out what caused it before it happens again.
A WhatsApp flow not triggering used to be something you inferred from send volume weeks after the fact. With a per-day count over 30 days it takes a few seconds: check the shape against your own orders, and if the shape is right but the level is low, the constraint is coverage rather than configuration. Work out what your coverage gap is worth before you spend the afternoon on it — calculate your Forecast and the number will tell you where to start.
Frequently asked questions
How far back does the trigger history go?
My flow shows triggers but no revenue. Is that the same problem?
Does a zero-trigger day mean nobody bought anything?
Which trigger types are not Shopify events?
Can I compare the graph across flows?
Nils Spölgen
Founder at Keaz. Serial founder in chat marketing — built a local agency into Keaz, the WhatsApp marketing platform for Shopify. Bootstrapped the MVP, raised funding, and scaled to 200+ merchants in DACH. Writes about flows, opt-in & GDPR, Klaviyo, and realistic revenue benchmarks — prefers conservative math over impressive claims. View profile